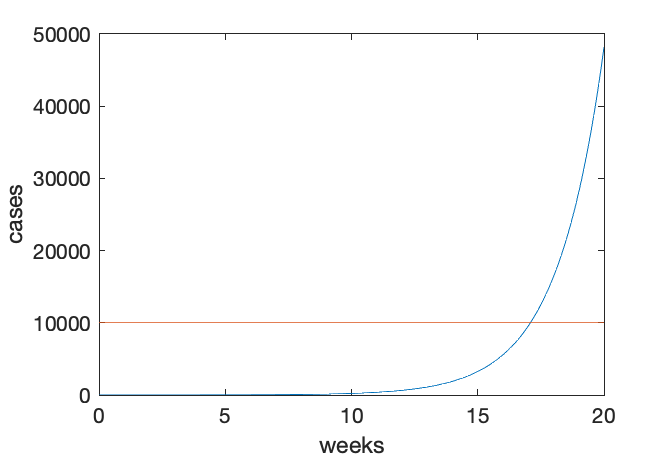
Triple Ring’s Chief Scientist Brian Wilfley, PhD, recently published the following article illustrating the exponential growth of Coronavirus cases on Medium:
People Don’t Comprehend Exponential Growth
“People are used to seeing graphs (plots) of Y vs. X: temperature vs. day of the week; or GDP vs. year. Given that training, why are plots of COVID-19 so hard to grasp? I think I observed something that may help to understand this difficulty.”

